27 API to download Thingspeak data with Python
An API (Application Programming Interface) is a set of rules and protocols that allow different software applications to communicate with each other.
In the code below, we will use Thingspeak’s API to read data, save it to file, and finally load it to python.
27.1 Import relevant packages
27.2 Download data from Thingspeak and save them to file
# define what to download
channels = "2076217"
fields = "1,2,3"

# see here all the "Query String Parameters"
# https://www.mathworks.com/help/thingspeak/readdata.html

results = 100
# Download the last N results
# url = f"https://api.thingspeak.com/channels/{channels}/fields/{fields}.csv?results={results}"

minutes = "30"
# Number of minutes before NOW to include in response.
# url = f"https://api.thingspeak.com/channels/{channels}/fields/{fields}.csv?minutes={minutes}"

start = "2023-04-16%2000:00:00"  # format YYYY-MM-DD%20HH:NN:SS
end = "2023-04-19%2000:00:00"    # format YYYY-MM-DD%20HH:NN:SS
url = f"https://api.thingspeak.com/channels/{channels}/fields/{fields}.csv?start={start}&end={end}"

# Open the URL and get the response
data = urllib.request.urlopen(url)
# Read the response data
d = data.read()
# save data to csv
filename1 = "downloaded_data.csv"
file = open(filename1, "w")
file.write(d.decode('UTF-8'))
file.close()
27.3 Load data as a pandas dataframe
# load data
df = pd.read_csv(filename1)
# rename columns
df = df.rename(columns={"created_at": "timestamp",
                        "field1": "Temp",
                        "field2": "RH",
                        "field3": "VPD",
                        # "field4": "whatever",
                        })
# set timestamp as index
df['timestamp'] = pd.to_datetime(df['timestamp'])
df = df.set_index('timestamp')
df| entry_id | Temp | RH | VPD | |
|---|---|---|---|---|
| timestamp | ||||
| 2023-04-16 00:01:20+00:00 | 3892 | 21.59 | 72.31 | 0.71442 |
| 2023-04-16 00:06:22+00:00 | 3893 | 21.60 | 72.14 | 0.71925 |
| 2023-04-16 00:11:24+00:00 | 3894 | 21.59 | 72.38 | 0.71262 |
| 2023-04-16 00:16:25+00:00 | 3895 | 21.59 | 71.86 | 0.72603 |
| 2023-04-16 00:21:27+00:00 | 3896 | 21.54 | 71.49 | 0.73333 |
| ... | ... | ... | ... | ... |
| 2023-04-18 18:58:48+00:00 | 4691 | 23.93 | 55.29 | 1.32931 |
| 2023-04-18 19:03:50+00:00 | 4692 | 23.98 | 55.25 | 1.33450 |
| 2023-04-18 19:08:52+00:00 | 4693 | 23.92 | 55.07 | 1.33505 |
| 2023-04-18 19:13:53+00:00 | 4694 | 23.92 | 59.84 | 1.19332 |
| 2023-04-18 19:18:17+00:00 | 4695 | 23.92 | 57.23 | 1.27087 |
804 rows × 4 columns
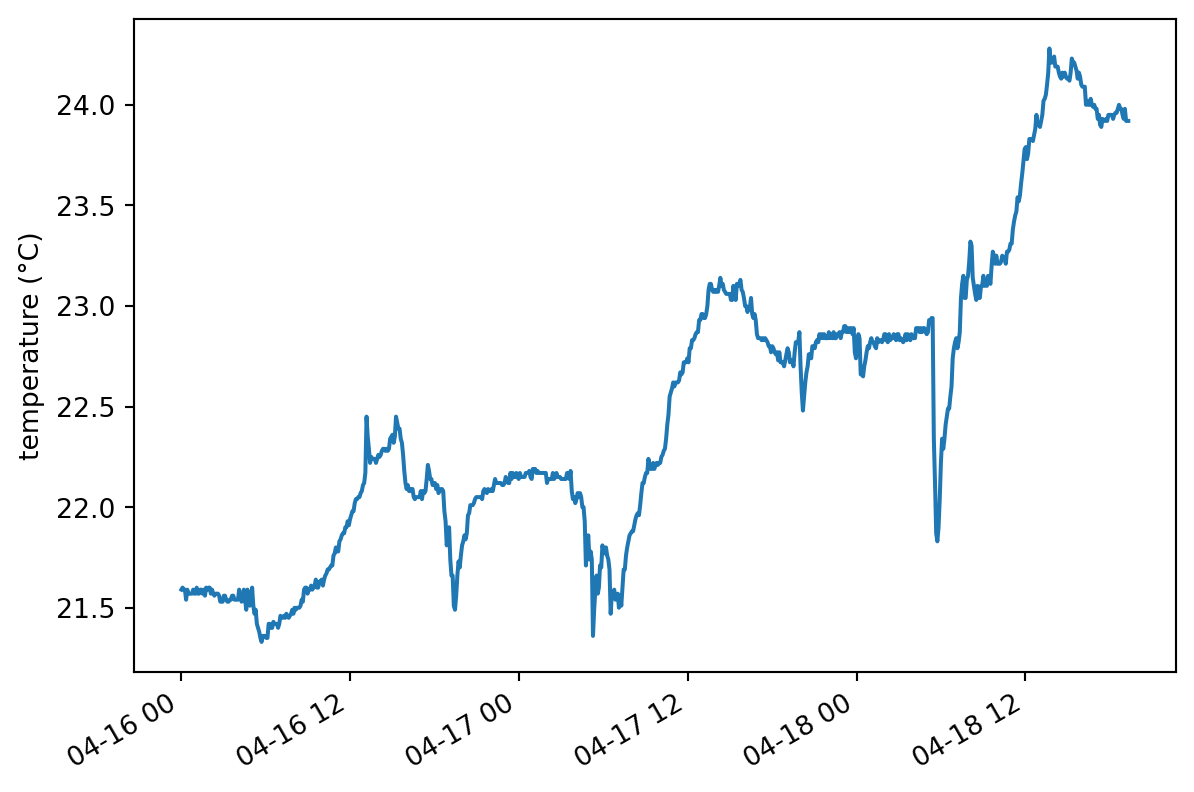
27.4 Plot data
Now you can manipulate your data however you want! Here we will simply plot one of the fields.